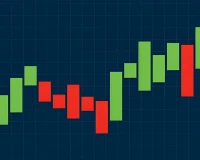
Currency charts are an essential tool for understanding price movement and analyzing market trends. Japanese candlesticks are the most commonly used, as each candle shows the opening, closing, high, and low prices over a specific period of time. A green candle indicates an uptrend and a red candle indicates a downtrend. By analyzing trends and technical indicators, traders can more accurately identify market conditions and potential trading opportunities
#News
16 Oct 2025

How to read a currency chart
Currency charts are an essential tool for understanding price movement and analyzing market trends....
Read More